본 글은 Loki Stack을 활용하여 설치하는 내용이다.
만약 Loki를 로그 시스템으로 도입하기 위해 필요한 내용들을 참고하고 싶다면 아래 글을 읽어보면 좋을 것 같다.
(아래 글은 설치 및 구성 방법에 대한 내용을 소개하지 않는다.)
https://nyyang.tistory.com/167
[EKS] 로그 시스템 Loki 도입을 위한 몇가지 운영 팁
Loki로 로그 시스템을 구성해서 쓴지 어느덧 3개월이 넘어간다. Loki를 맨 처음에는 Loki Stack(Grafana, Promtail, Loki)로 구성해서 모놀리식 형태로 쓸 수 있지만 쓰다보면 다양한 문제점들이 발견된다. 1.
nyyang.tistory.com
1. 개요
ELK 스택이 부담스럽다면 Loki Stack(Promtail + Loki + Grafana)을 통해 간단하게 로깅 시스템을 구성할 수 있다.
운영계에 도입하기 위해서는 고가용성 및 속도 등 고려해야 할 요소가 더욱 많겠지만 개발계의 경우 크게 걱정하지 않아도 될 것으로 생각한다.
1.1. 구성 요소
loki-stack (Helm)
로깅 : Grafana + Promtail + Loki
인증 : okta with grafana (oidc)
2. 구성
Loki Stack에 대해 간단하게 알아보자.
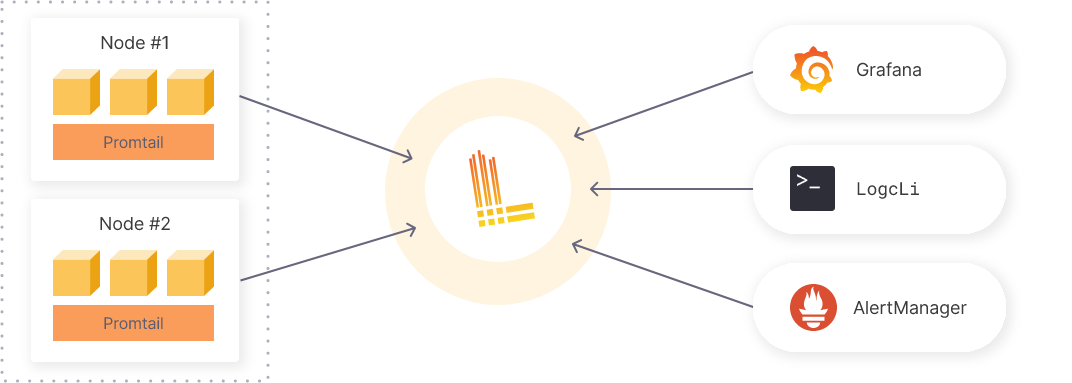
Promtail : 각 EKS 노드에 DaemonSet으로 구성되며 파드 및 컨테이너 로그가 저장된 /var/log/pods/를 마운트하며 실시간으로 로그를 조회하여 테일링하고, Loki에게 전달한다.
Loki : 로그를 실시간 집계하는 백엔드 시스템이다.
Grafana : Loki와 연동하여 Web UI를 통해 시각화를 할 수 있도록 도와준다.
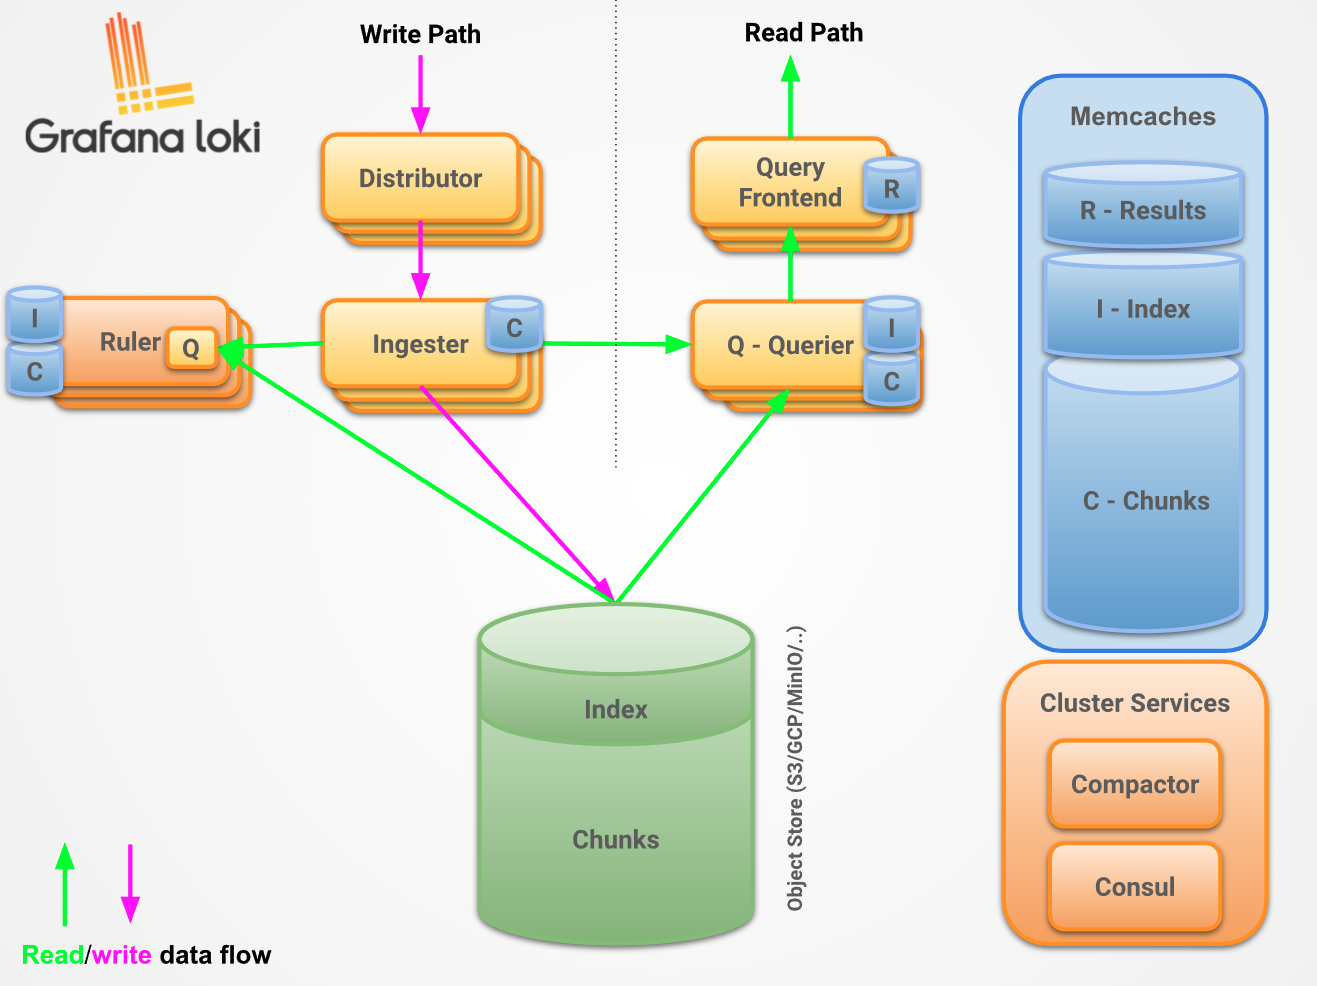
[Loki 데이터 저장 방식]
Distributor : 수신되는 Stream을 컨트롤 하는 역할
Ingester : Log Data를 Distributor에게 수신하여 스토리지에 저장하는 역할
Querier : 로그를 쿼리하여 가져와 중복을 제거한 후 Grafana또는 Query-Frontend에게 데이터를 반환
Chunk Store : Loki의 로그를 저장
Chunk Store는 다음의 Storage들을 지원한다.
Filesystem (please read more about the filesystem to understand the pros/cons before using with production data)
물론 개발계이기 때문에 간단하게 Filesystem을 사용할 예정이다.
3. Loki , Grafana, Promtail, Prometheus 구성
주요 설정
[1] 가급적이면 모든 Container 리소스에 CPU, Memory request, limit 값을 설정
[2] Promtail은 DaemonSet으로 구성 예정
[3] Loki의 볼륨은 File System으로 관리 : 운영계일 경우 Loki : S3와 DynamoDB 혹은 Minio 등을 고려할 수 있겠지만 개발계에 로그와 모니터링 시스템을 구성할 예정이기 때문에 큰 상관이 없을 것이라 판단되어 파일 시스템으로 구성하되 최소한의 안전 장치로 PVC를 사용
[4] kube-system이나 istio-system 네임스페이스에 대한 로깅은 굳이 필요가 없을 것이라 판단되어 로그를 Loki로 보내지 않도록 설정
[5] grafana의 경우 okta와 oidc를 통해 인증을 수행할 수 있도록 설정 : client_id와 client_secret은 --set 옵션을 통해 넣을 수 있도록 설정한다.
[6] Loki, Prometheus, Grafana의 경우 특정 Node group에 배포될 수 있도록 nodeSelector 설정
[7] Grafana가 기동될 때 Dashboard를 자동으로 Import 하도록 설정 (Dashboard 관련 데이터를 저장하는 디렉터리 Volume이 emptyDir이기 때문에 컨테이너가 재기동되면 날라간다.)
[8] 네트워크 설정은 Istio Gateway, VirtualService로 간단하게 수행한다.
[9] Retention 기간은 24h로 설정 (필요할 경우 늘리면 됌)
3.1. values.yaml
test_pod:
  image: bats/bats:v1.1.0
  pullPolicy: IfNotPresent

loki:
  enabled: true
  resources:
    requests:
      cpu: 500m
      memory: 1024Mi
    limits:
      cpu: 500m
      memory: 1024Mi
  nodeSelector:
    aaa: bbb
  isDefault: true
  url: http://{{(include "loki.serviceName" .)}}:{{ .Values.loki.service.port }}
  readinessProbe:
    httpGet:
      path: /ready
      port: http-metrics
    initialDelaySeconds: 45
  livenessProbe:
    httpGet:
      path: /ready
      port: http-metrics
    initialDelaySeconds: 45
  datasource:
    jsonData: {}
    uid: ""
  # Retention 설정
  config:
    chunk_store_config:
      max_look_back_period: 24h
    table_manager:
      retention_deletes_enabled: true
      retention_period: 24h
  persistence:
    enabled: true
    size: 10Gi
    storageClassName: ebs-sc

promtail:
  enabled: true
  resources:
    requests:
      cpu: 10m
      memory: 64Mi
    limits:
      cpu: 100m
      memory: 128Mi
  config:
    logLevel: info
    serverPort: 3101
    clients:
      - url: http://{{ .Release.Name }}:3100/loki/api/v1/push
    snippets:
      scrapeConfigs: |
        # See also <https://github.com/grafana/loki/blob/master/production/ksonnet/promtail/scrape_config.libsonnet> for reference
        - job_name: kubernetes-pods
          pipeline_stages:
            {{- toYaml .Values.config.snippets.pipelineStages | nindent 4 }}
          kubernetes_sd_configs:
            - role: pod
          relabel_configs:
            - source_labels:
                - __meta_kubernetes_pod_controller_name
              regex: ([0-9a-z-.]+?)(-[0-9a-f]{8,10})?
              action: replace
              target_label: __tmp_controller_name
            - source_labels:
                - __meta_kubernetes_pod_label_app_kubernetes_io_name
                - __meta_kubernetes_pod_label_app
                - __tmp_controller_name
                - __meta_kubernetes_pod_name
              regex: ^;*([^;]+)(;.*)?$
              action: replace
              target_label: app
            - source_labels:
                - __meta_kubernetes_pod_label_app_kubernetes_io_instance
                - __meta_kubernetes_pod_label_release
              regex: ^;*([^;]+)(;.*)?$
              action: replace
              target_label: instance
            - source_labels:
                - __meta_kubernetes_pod_label_app_kubernetes_io_component
                - __meta_kubernetes_pod_label_component
              regex: ^;*([^;]+)(;.*)?$
              action: replace
              target_label: component
            {{- if .Values.config.snippets.addScrapeJobLabel }}
            - replacement: kubernetes-pods
              target_label: scrape_job
            {{- end }}
            {{- toYaml .Values.config.snippets.common | nindent 4 }}
            {{- with .Values.config.snippets.extraRelabelConfigs }}
            {{- toYaml . | nindent 4 }}
            {{- end }}
            # exclude logs
            - source_labels: [__meta_kubernetes_namespace]
              action: drop
              regex: kube-system|istio-system|elastic-system|loki
            - source_labels: [__meta_kubernetes_pod_container_name]
              action: drop
              regex: metricbeat|filebeat|istio-proxy|istio-init

# Grafana
grafana:
  enabled: true
  sidecar:
    datasources:
      enabled: true
      maxLines: 1000
  image:
    tag: 8.3.5
  nodeSelector:
		aaa: bbb
  grafana.ini:
    server:
      root_url: <https://loki.dev.xxxxx.xxxxx>
    auth.okta:
      name: Okta
      icon: okta
      enabled: true
      allow_sign_up: true
      client_id:
      client_secret:
      scopes: openid profile email groups
      auth_url: <https://xxxxx.okta.com/oauth2/v1/authorize>
      token_url: <https://xxxxx.okta.com/oauth2/v1/token>
      api_url: <https://xxxxx.okta.com/oauth2/v1/userinfo>
      allowed_domains:
      allowed_groups:
      role_attribute_path: contains(groups, 'xxxxx') && 'Admin' || 'Editor'
  dashboardProviders:
    dashboardproviders.yaml:
      apiVersion: 1
      providers:
      - name: 'default'
        orgId: 1
        folder: ''
        type: file
        disableDeletion: false
        editable: true
        options:
          path: /var/lib/grafana/dashboards/default
  dashboards:
    default:
      Loki-logs:
        gnetId: 13639
        revision: 2
        datasource: Loki

# 비활성화
prometheus:
  enabled: false

fluent-bit:
  enabled: false

filebeat:
  enabled: false

logstash:
  enabled: false

proxy:
  http_proxy: ""
  https_proxy: ""
  no_proxy: ""
3.2. 설치
# Add a autoscaler repository
helm repo add grafana <https://grafana.github.io/helm-charts>
# Update and
helm repo update grafana
# Local로 Chart를 받아옴
helm pull grafana/loki-stack
tar -xvf ~~
# 설치
helm upgrade --install -f values.yaml --create-namespace -n logging loki ./ \\ system ⎈ ip-dev/search-service-qa 14:00:28
--set 'grafana.grafana\\.ini.auth\\.okta.client_id=XXXXXXX' \\
--set 'grafana.grafana\\.ini.auth\\.okta.client_secret=XXXXXXX'
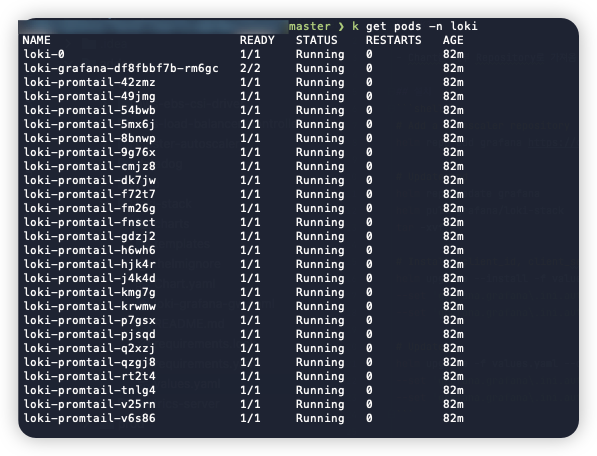
설치 모습
3.3. Istio Gateway
물론 Gateway, Virtual Service 설정하고 Route 53에도 loki.dev.xx.xx에 대해 ALB로 트래픽이 인입되도록 설정해야 한다.
apiVersion: networking.istio.io/v1alpha3
kind: Gateway
metadata:
  name: loki-grafana
  namespace: loki
spec:
  selector:
    istio: ingressgateway-alb
  servers:
    - port:
        number: 80
        name: http
        protocol: HTTP
      hosts:
        - "*"
---
apiVersion: networking.istio.io/v1alpha3
kind: VirtualService
metadata:
  name: loki-grafana
  namespace: loki
spec:
  hosts:
    - "loki.dev.xxxx.xxxx"
  gateways:
    - mesh
    - loki-grafana
  http:
    - route:
        - destination:
            port:
              number: 80
            host: loki-grafana
3.4. Okta 인증 연동
Okta 설정


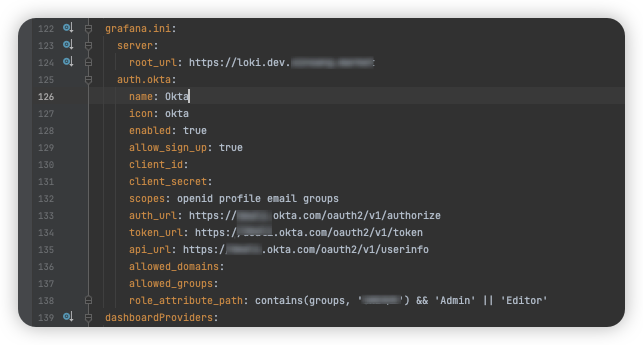
Grafana 인증 설정
root_url , auth.okta 설정
role_attribute_path : RBAC 설정을 할 수 있다. (Admin, Editor, Viewer)
만약 세부적인 권한 작업을 하고 싶다면 Enterprise 사용해야 함. (그럴 필요 없을듯)
위에는 3개의 Okta 그룹을 허용했지만 grafana.ini에는 1개의 그룹만 Admin 권한을 부여하고 나머지는 모두 Editor 권한을 갖게 될 것이다.
3.4.1. Okta 로그인
아무 설정도 안하면 기본 권한이 Viewer인데, 기본 권한으로 미리 설정해둔 Admin로 설정된 것을 확인할 수 있다.

4. 사용해보기
좌측 네모 4개 → Dashboards → Browse를 클릭하면 다음의 Dashboard를 확인할 수 있다.
Promtail이 자동으로 로그 데이터에 Label들을 달아준다.

Explore를 클릭하면 ‘Loki’란 Data source로부터 인입되는 데이터들을 확인할 수 있는데 kube-system 등은 Log에서 제외가 된 것을 확인할 수 있다.

보다시피 정말 가볍게 Loki로 로깅 시스템을 구성했다. 오픈소스인데 Grafana로 Auth0나 Keyclock 등으로 인증도 가능하다!
Ref
https://devocean.sk.com/blog/techBoardDetail.do?ID=163659
https://community.grafana.com/t/redirect-uri-mismatch-error-in-google-oauth/35659/4
'Log,Monitorings' 카테고리의 다른 글
| [Observability] fluentd 보다 더 좋은(?) Vector에 대해 알아보자. (1) | 2023.06.10 |
|---|---|
| [EKS] 로그 시스템 Loki 도입을 위한 몇가지 운영 팁 (7) | 2023.03.11 |
| [Datadog] EKS에서 운영중인 SpringBoot HikarpCP 모니터링 (Auto Discovery) (0) | 2022.09.09 |
| [Datadog] AWS Events 기반으로 Datadog 알람 설정하기 (0) | 2022.06.26 |
| [Elasticsearch] Nginx 로그 Fluentd를 통해 Elasticsearch로 보내기 (0) | 2021.12.20 |


