일반적으로 Promtail, Logstash, fluentBit 등을 통해 로그를 전송하는 방법이 일반적이다.
하지만 경우에 따라서는 별도 개발언어를 사용하여 커스텀하게 Loki로 Log를 전송할 수 있다.
당연히 Loki도 HTTP API를 지원하기에 API Spec에 따라 POST로 로그를 전송하면 되기 때문이다.
https://grafana.com/docs/loki/latest/api/#push-log-entries-to-loki
Grafana Loki HTTP API | Grafana Loki documentation
Open source Grafana Loki HTTP API Grafana Loki exposes an HTTP API for pushing, querying, and tailing log data. Note that authenticating against the API is out of scope for Loki. Microservices mode When deploying Loki in microservices mode, the set of endp
grafana.com
- POST
- /loki/api/v1/push
- data
3가지만 기억하면 Javascript, Java, Python, Ruby 등 어떤 언어든지 로그를 전송할 수 있다.

Python으로 Loki에 로그를 전송하는 예시
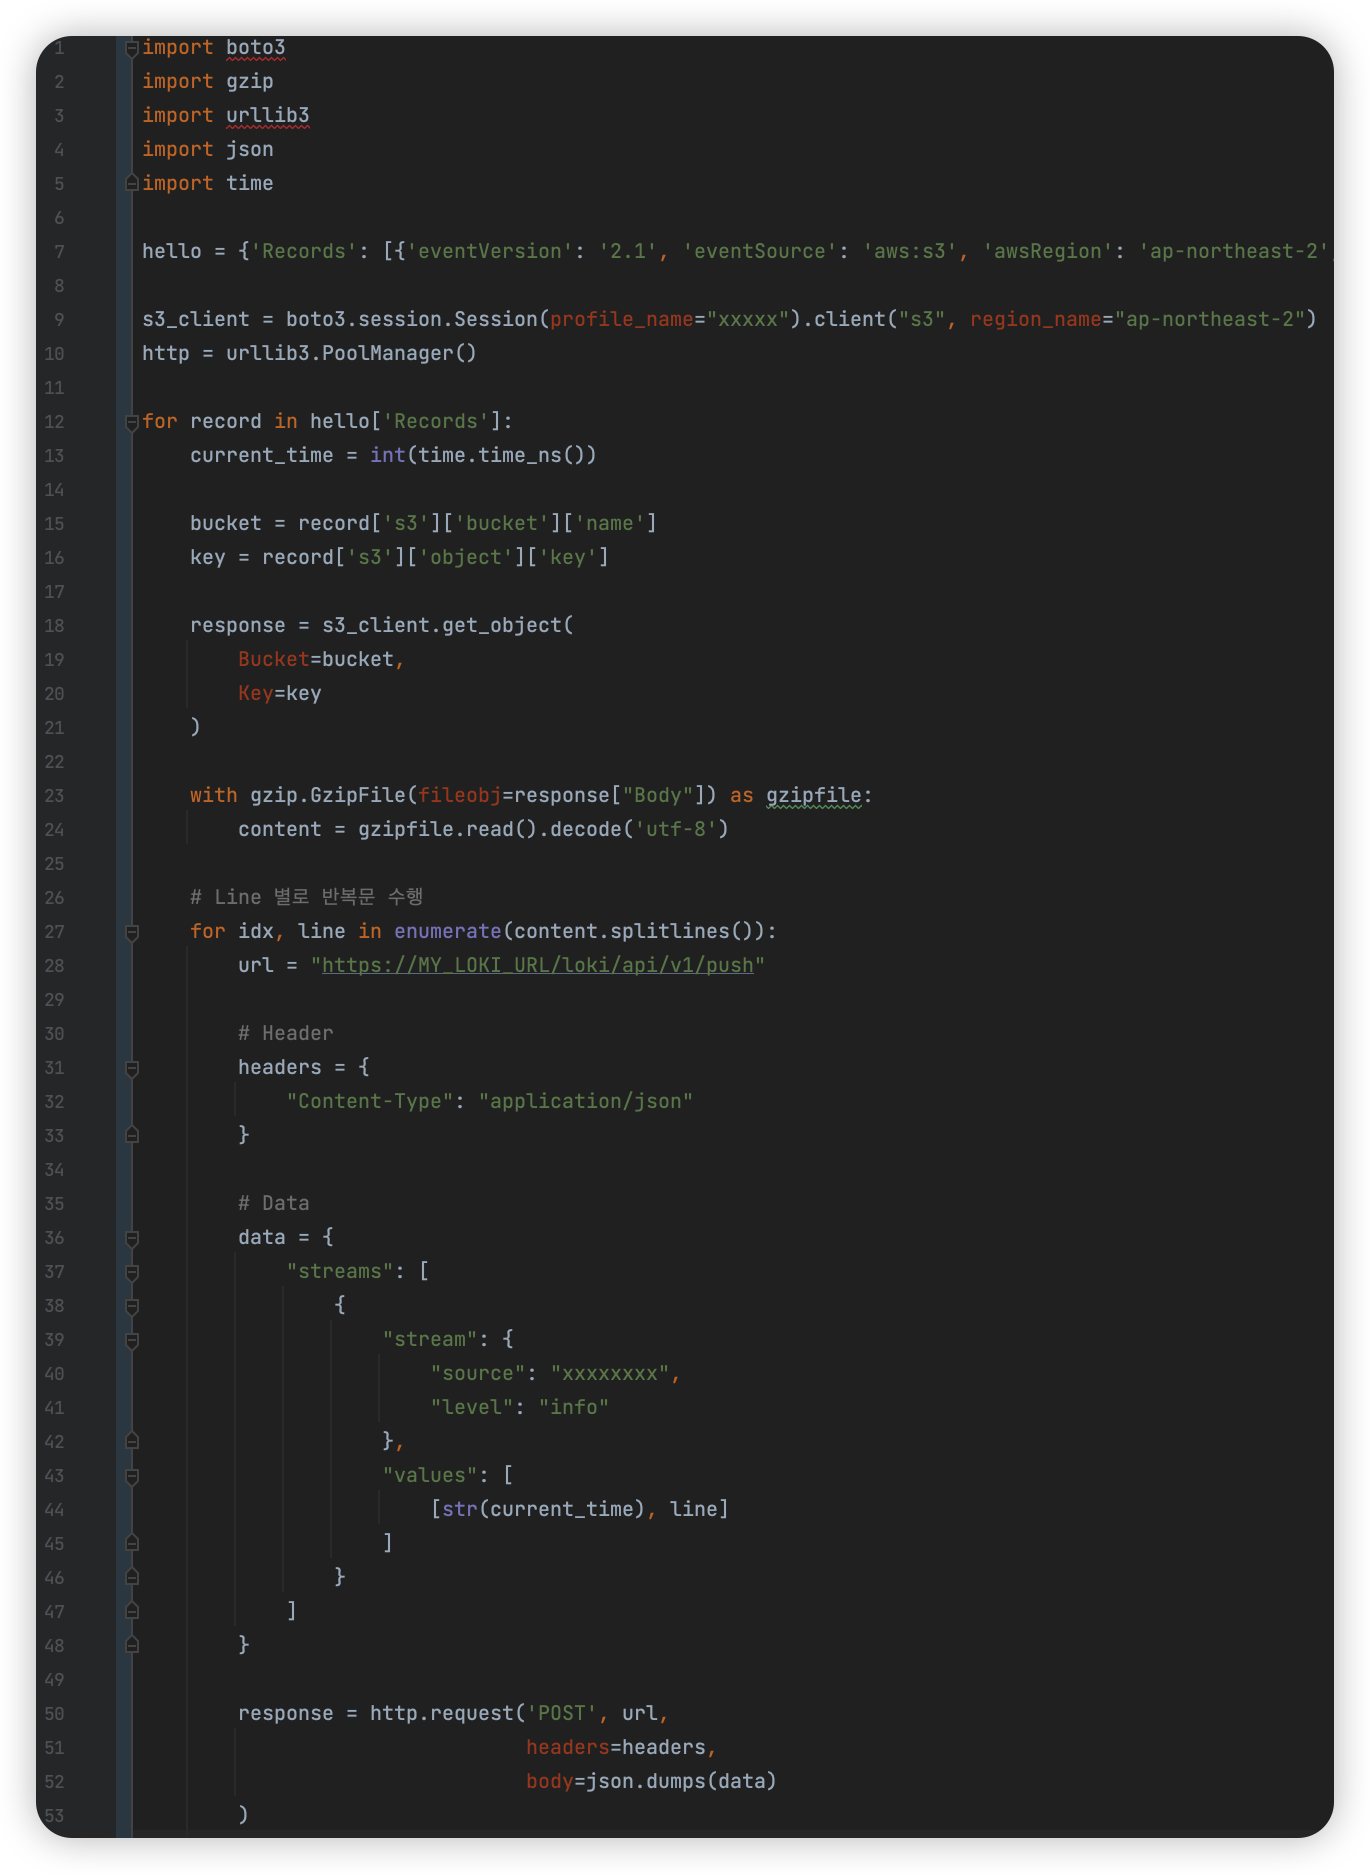
위 예시는 S3에 Object가 생성될 경우 Lambda에서 S3로부터 event를 전달받아 파싱한 뒤 각 Line을 반복문 돌아서 Loki로 전송하는 예시이다.
current_time = int(time.time_ns())
-> unix_timestamp를 나노세컨드로 저장한다.
with gzip.GzipFile(fileobj=response["Body"]) as gzipfile:
content = gzipfile.read().decode('utf-8')
-> gzip 파일을 압축 풀어서 읽은 뒤 content란 변수로 사용할 수 있도록 한다.
data = {
"streams": [
{
"stream": {
"source": "xxxxxxxx",
"level": "info"
},
"values": [
[str(current_time), line]
]
}
]
}
-> 공식문서에 의거하여 포맷을 맞춰준다.
끝이다..
"level": "info"로 하면 Loki 검색 시 초록색으로 뜨고 만약 level: error 이런식으로 하면 당연히 빨간색으로 뜰 것이다.
이건 필요에 따라 level을 설정하면 될 것으로 보인다...
'Log,Monitorings' 카테고리의 다른 글
| [Monitoring] Grafana Tempo 알아보기 (3) | 2023.11.23 |
|---|---|
| [EKS] Data Transfer 비용 절감 작업 (istio destination rule, topology aware hints) (2) | 2023.09.14 |
| Grafana Monitoring 스택 LGTM 구성기 (Loki, Mimir, Tempo) (4) | 2023.08.10 |
| [Prometheus] AlertManager로 Slack 알람 전송하는 법 알아보자 (0) | 2023.07.29 |
| [Observability] fluentd 보다 더 좋은(?) Vector에 대해 알아보자. (1) | 2023.06.10 |


